![Brand_Mark_Vertical_Primary_ver1.1.png]](https://support.customer-alliance.com/hs-fs/hubfs/Brand_Mark_Vertical_Primary_ver1.1.png?width=120&height=111&name=Brand_Mark_Vertical_Primary_ver1.1.png)
The dashboard is a top section in the CEMI system where you can monitor and analyze your overall performance.
On the platform, we provide you with two subsections for our Dashboard:
- My KPI’s: customizable dashboard with your selected KPIs.
- General Overview: displays pre-defined indicators.
My KPI’s
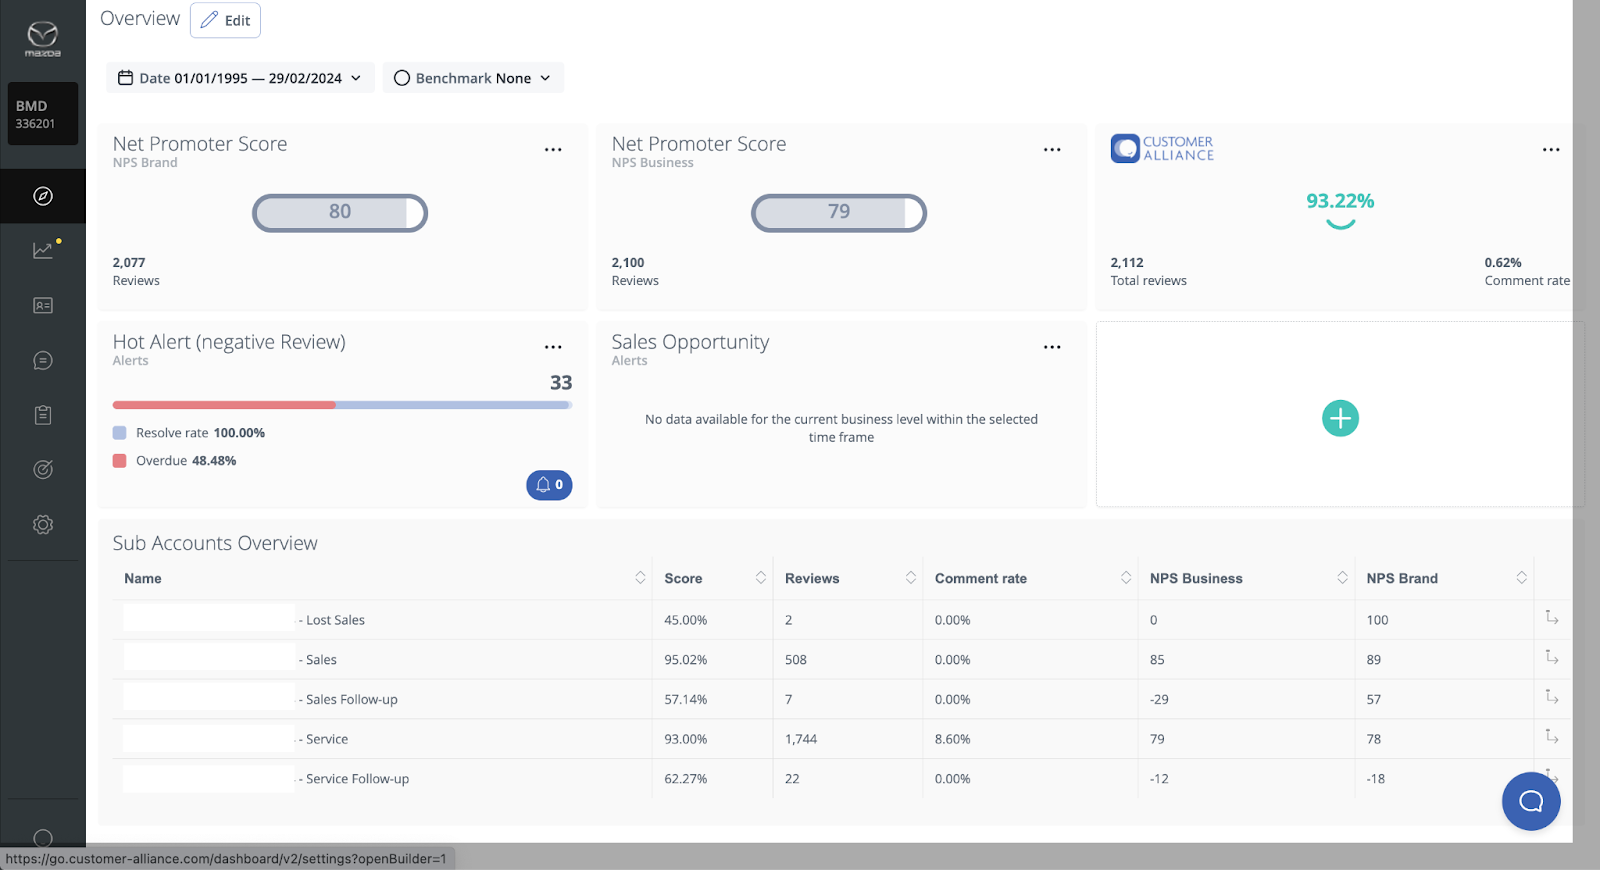
My KPI’s subsection gives you the opportunity to fully customise your dashboard with your top KPI’s. By default, you will find here the following tiles:
- Portal Score for CEMI reviews only
- Net Promoter Score Brand and Business
- Alerts (hot alert, sales opportunity, bounced email)
- Sub Account Overview
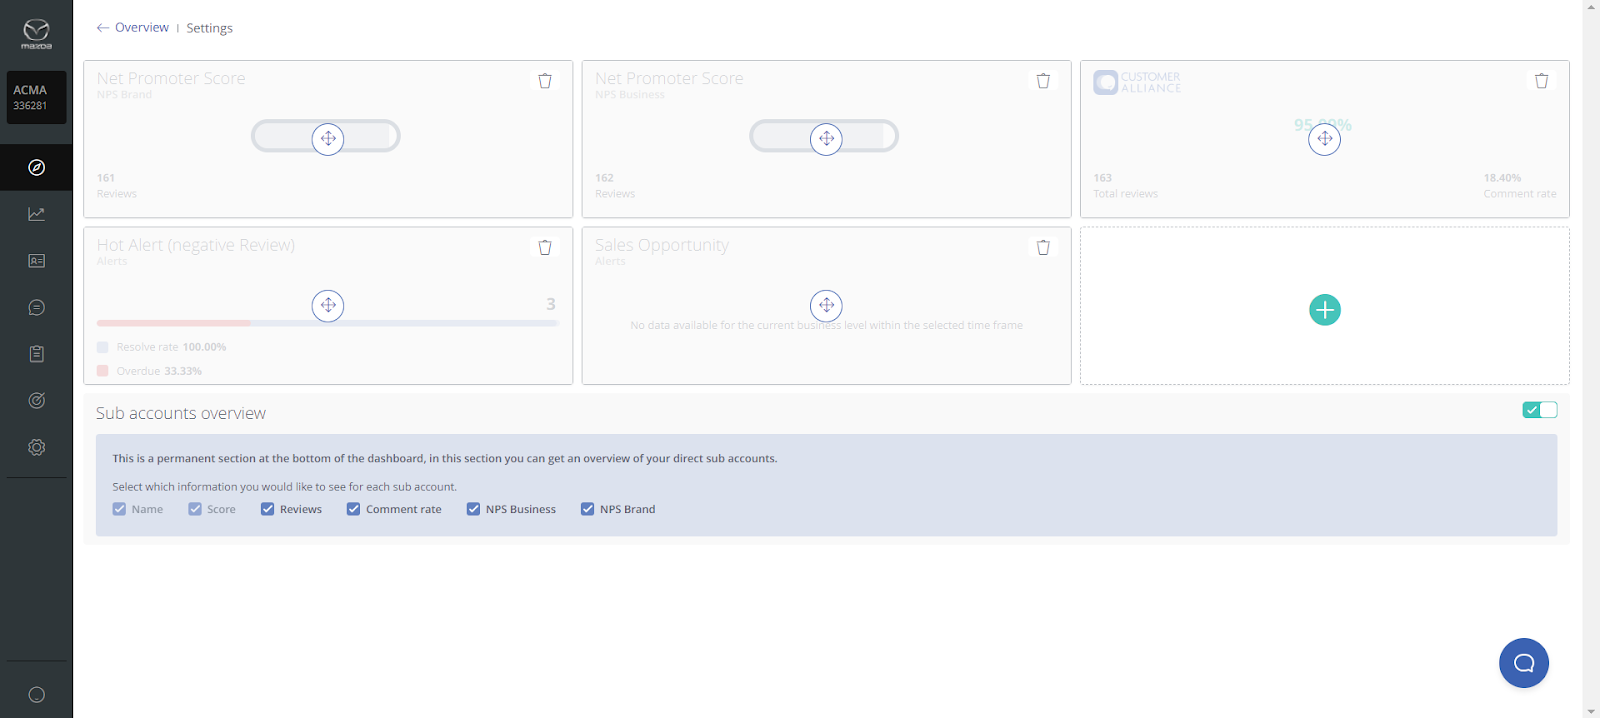
How to add a new tile or delete the existing one
If you want to add a new tile, you just need to click the “Edit” button next to the Overview label. Select the topic you'd like to see appear in the dashboard from the drop-down list and add it.
When you are in edit mode, you can also delete the not-needed tiles by clicking on the bin in the upper right corner of the tile. Being in this mode you can also arrange the selected topics in any order you wish.
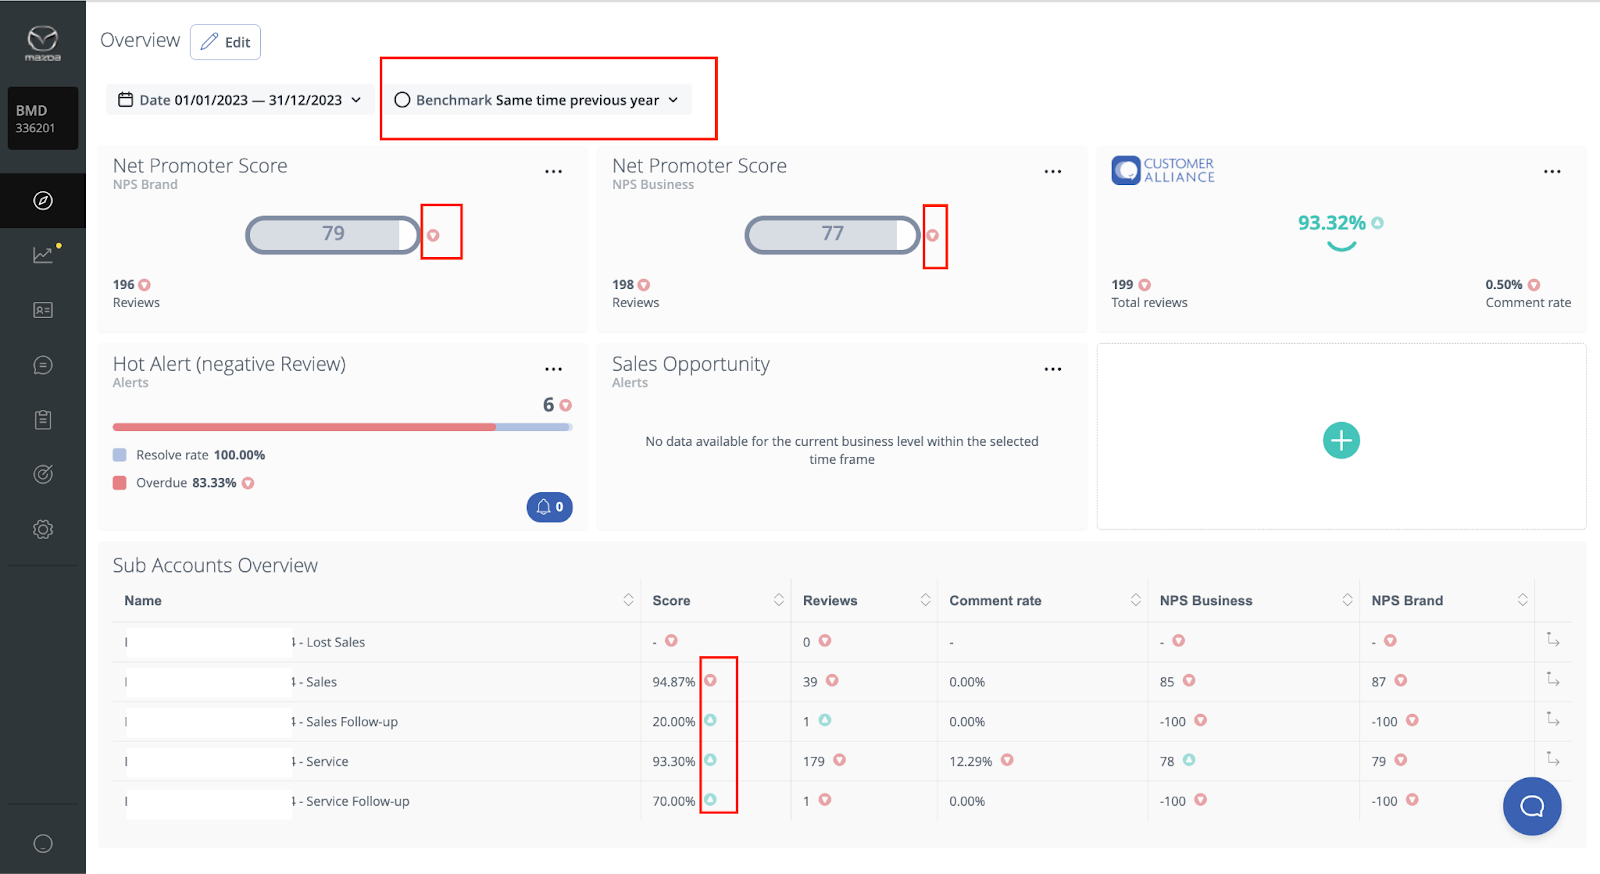
Benchmark
Thanks to the benchmark option you are able to compare your numbers for the selected time frame with the national average for this period, with the numbers in the same time but in the previous year or the same time period of the previous duration. When you choose one of the options, to see the benchmark numbers just hover the mouse over the icon which is next to the numbers visible in your dashboard. If you click on this icon, you will be forwarded to the Statistics section to check all the details.
Sub Accounts Overview
In the tile Sub Accounts Overview, you will see the results for all the different surveys according to the time range selected in the filter (take a look at the screenshot above).
You may sort the contents of this table simply by clicking on each headline (Score, Reviews, Comment rate, Business NPS, Brand NPS). That will provide you with a quick overview about which survey has the best/worst score for that metric.
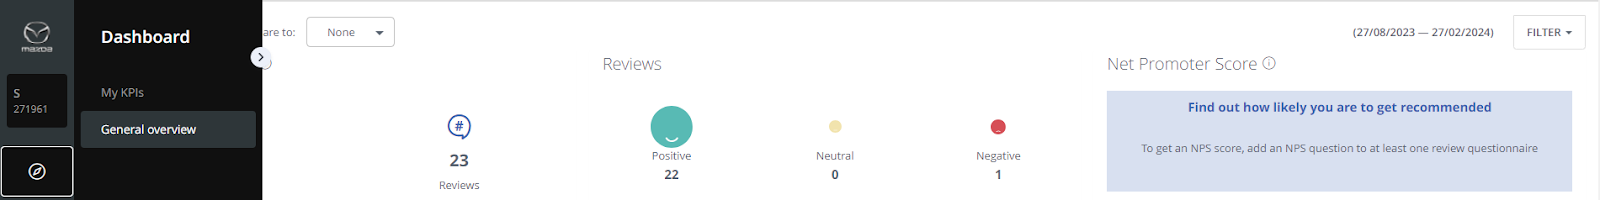
General Overview
The general overview displays pre-defined indicators:
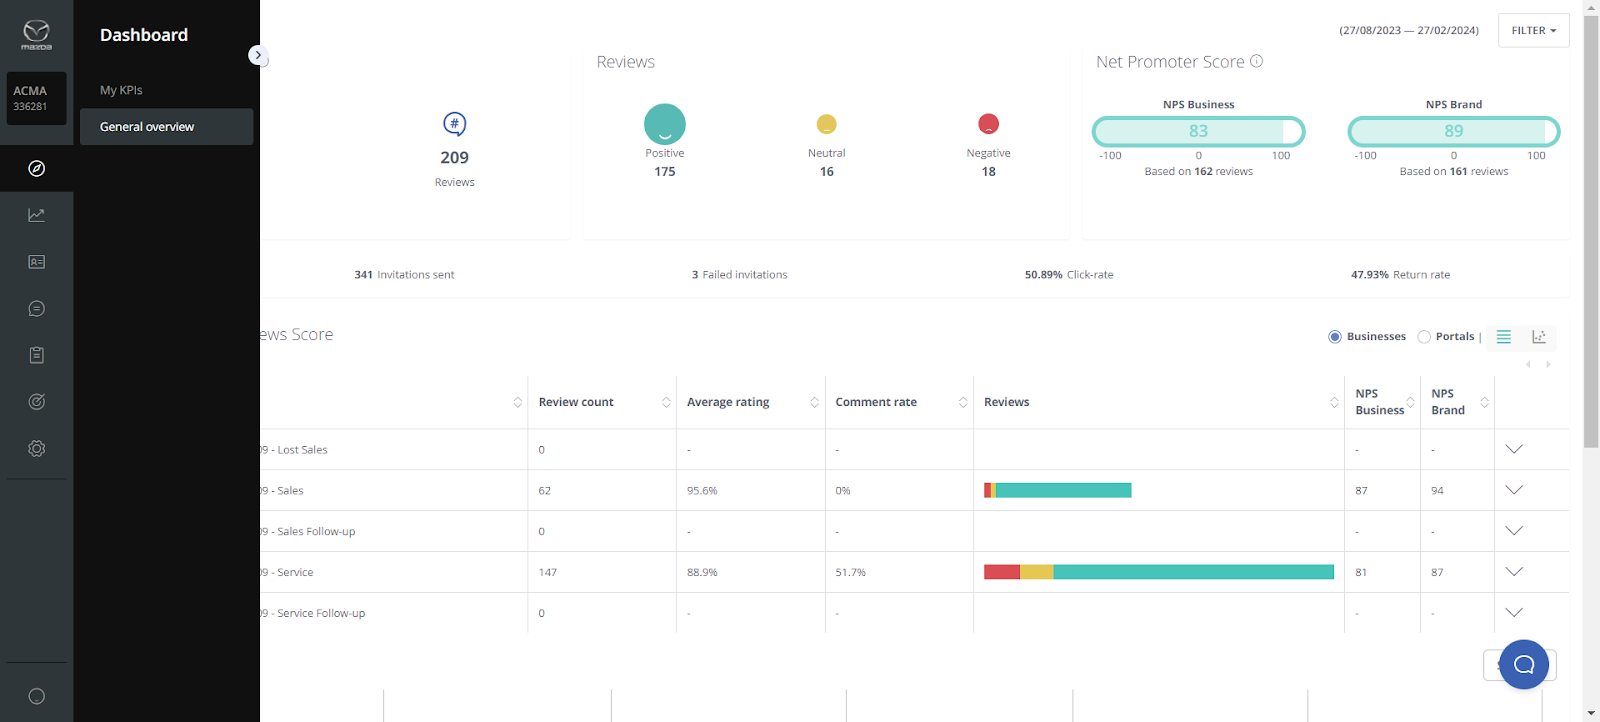
In the left box, you will be able to see the public reviews score and total number of reviews collected in a specific time range. Be aware that depending on which account level you have previously selected in the menu you will see the results accordingly).
Rating percentage (public review score) shows you the customer satisfaction index for the time frame selected. This score is calculated on the questions:
- Sales Survey: “How satisfied are you with the overall purchase experience?”
- Service Survey: “How satisfied are you with the overall service experience?”
- Lost Sales Survey (if applicable): “How would you rate your overall experience with the dealership?”
- Follow-Up Sales: How satisfied are you with the overall purchase experience of your Mazda - at XYZ?
- Service Surveys: How satisfied are you with the overall service or repair experience of your Mazda - at XYZ?
IMPORTANT: For the public review score we also calculate reviews from external portals (if applicable for your market).
In the central box, Reviews are separated into positive, neutral, and negative scores based on the following questions:
- Sales Survey: “How satisfied are you with the overall purchase experience?”
- Service Survey: “How satisfied are you with the overall service experience?”
- Lost Sales Survey (if applicable): “How would you rate your overall experience with the dealership?”
Reviews are considered:
- Positive => if the score is 9-10 OR 5 (for 5-point scale countries)
- Neutral => if the score is 7-8 OR 4 (for 5-point scale countries)
- Negative => if the score is 0-6 OR 1-3 (for 5-point scale countries)
You can click on the smileys to view the reviews related to each classification.
The Net Promoter Scores on the right side show you the aggregated results of the two NPS questions.
- NPS Business: “Based on your purchase experience/your recent service experience, how likely would you be to recommend the dealer to your friends/relatives/business colleagues?”
- NPS Brand: “How likely would you be to recommend the brand Mazda to your friends/relatives/ business colleagues?”
Invitation Statistics
Right below the main KPI widget, you will have the possibility to check the invitation statistics related to the survey you’re navigating into:
- Invitations sent => how many customers have been asked to submit a review
- Failed Invitations => how many emails could not be sent (due to wrong spelling, for example)
- Click-rate => how many customers have opened the questionnaire
- Return rate => how many have submitted a review in the end

Overview – Public Review Score
In your main level view, you will visualise an “Overview – Public Review Score” widget just below the invitation results widget. This will provide you with a quick overview about your aggregated results for all the different surveys.
You may sort the content of this table simply by clicking on each headline (Review count, Average rating, Comment rate, Business NPS, Brand NPS). That will provide you with a quick overview about which survey has the best / worst score for that metric.
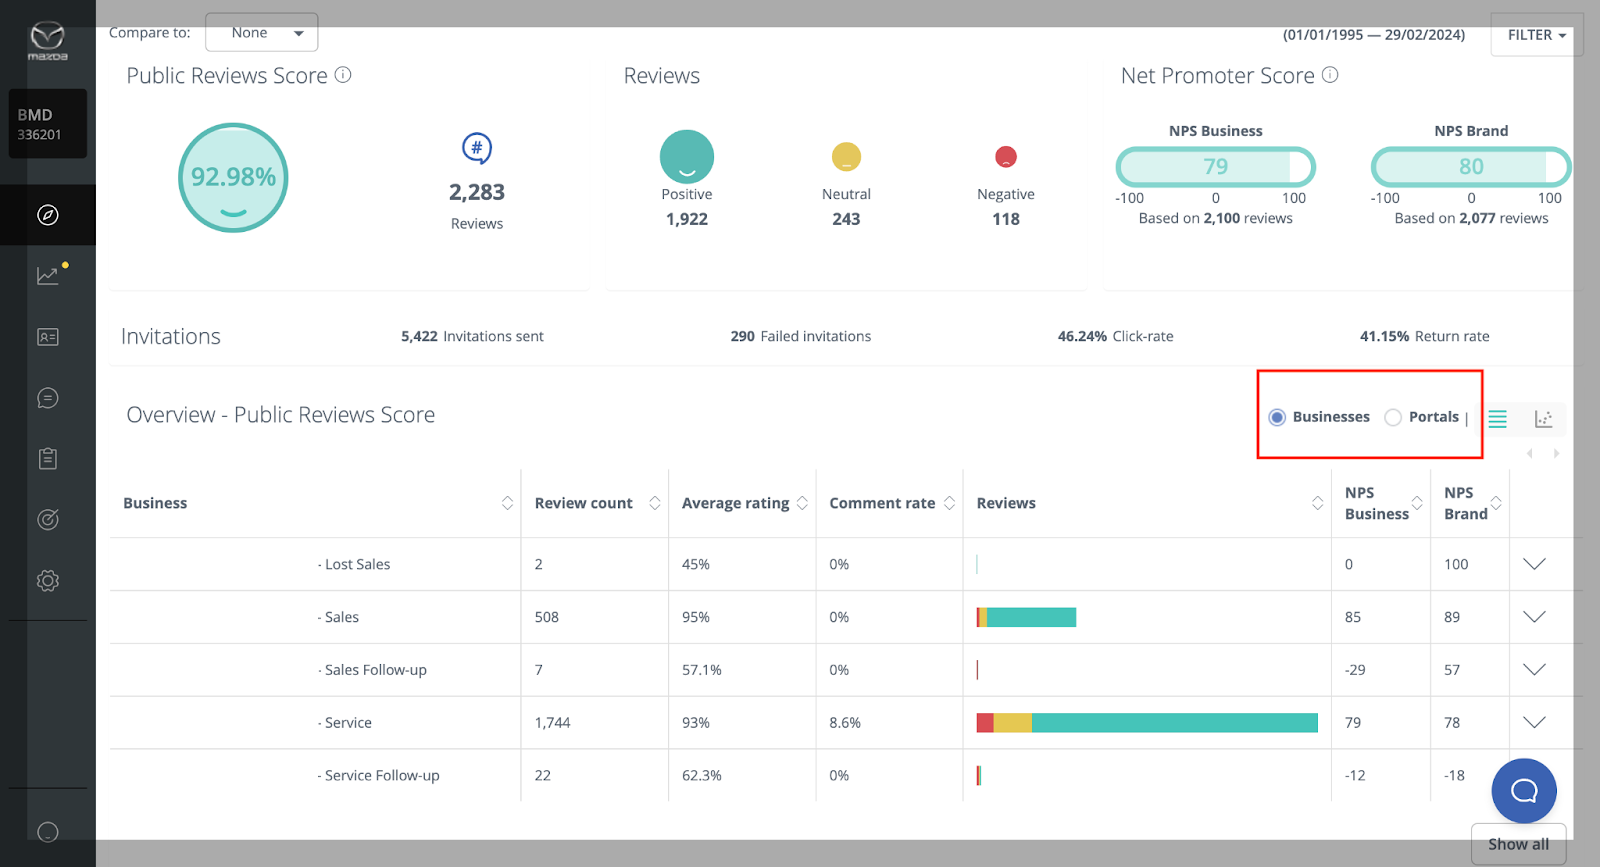
You can also change the overview in the table from “Business” to “Portals” (marked in red on the screenshot above). Then you will see all the results split by portals we monitor for you.
Did this answer your question? Thanks for the feedback There was a problem submitting your feedback. Please try again later.Yes No No results found