![Brand_Mark_Vertical_Primary_ver1.1.png]](https://support.customer-alliance.com/hs-fs/hubfs/Brand_Mark_Vertical_Primary_ver1.1.png?width=120&height=111&name=Brand_Mark_Vertical_Primary_ver1.1.png)
The benchmark option is available for you in 2 sections of the system:
- Dashboard - My KPIs,
- Analytics 360 - Statistics.
Thanks to the benchmark option you are able to compare your numbers for the selected time frame with the national average for this period, with the numbers in the same time but in the previous year or same time period of previous duration.
For you, it means that you will be able to compare month to previous month, quarter to previous quarter or half-year to the previous half-year, etc.
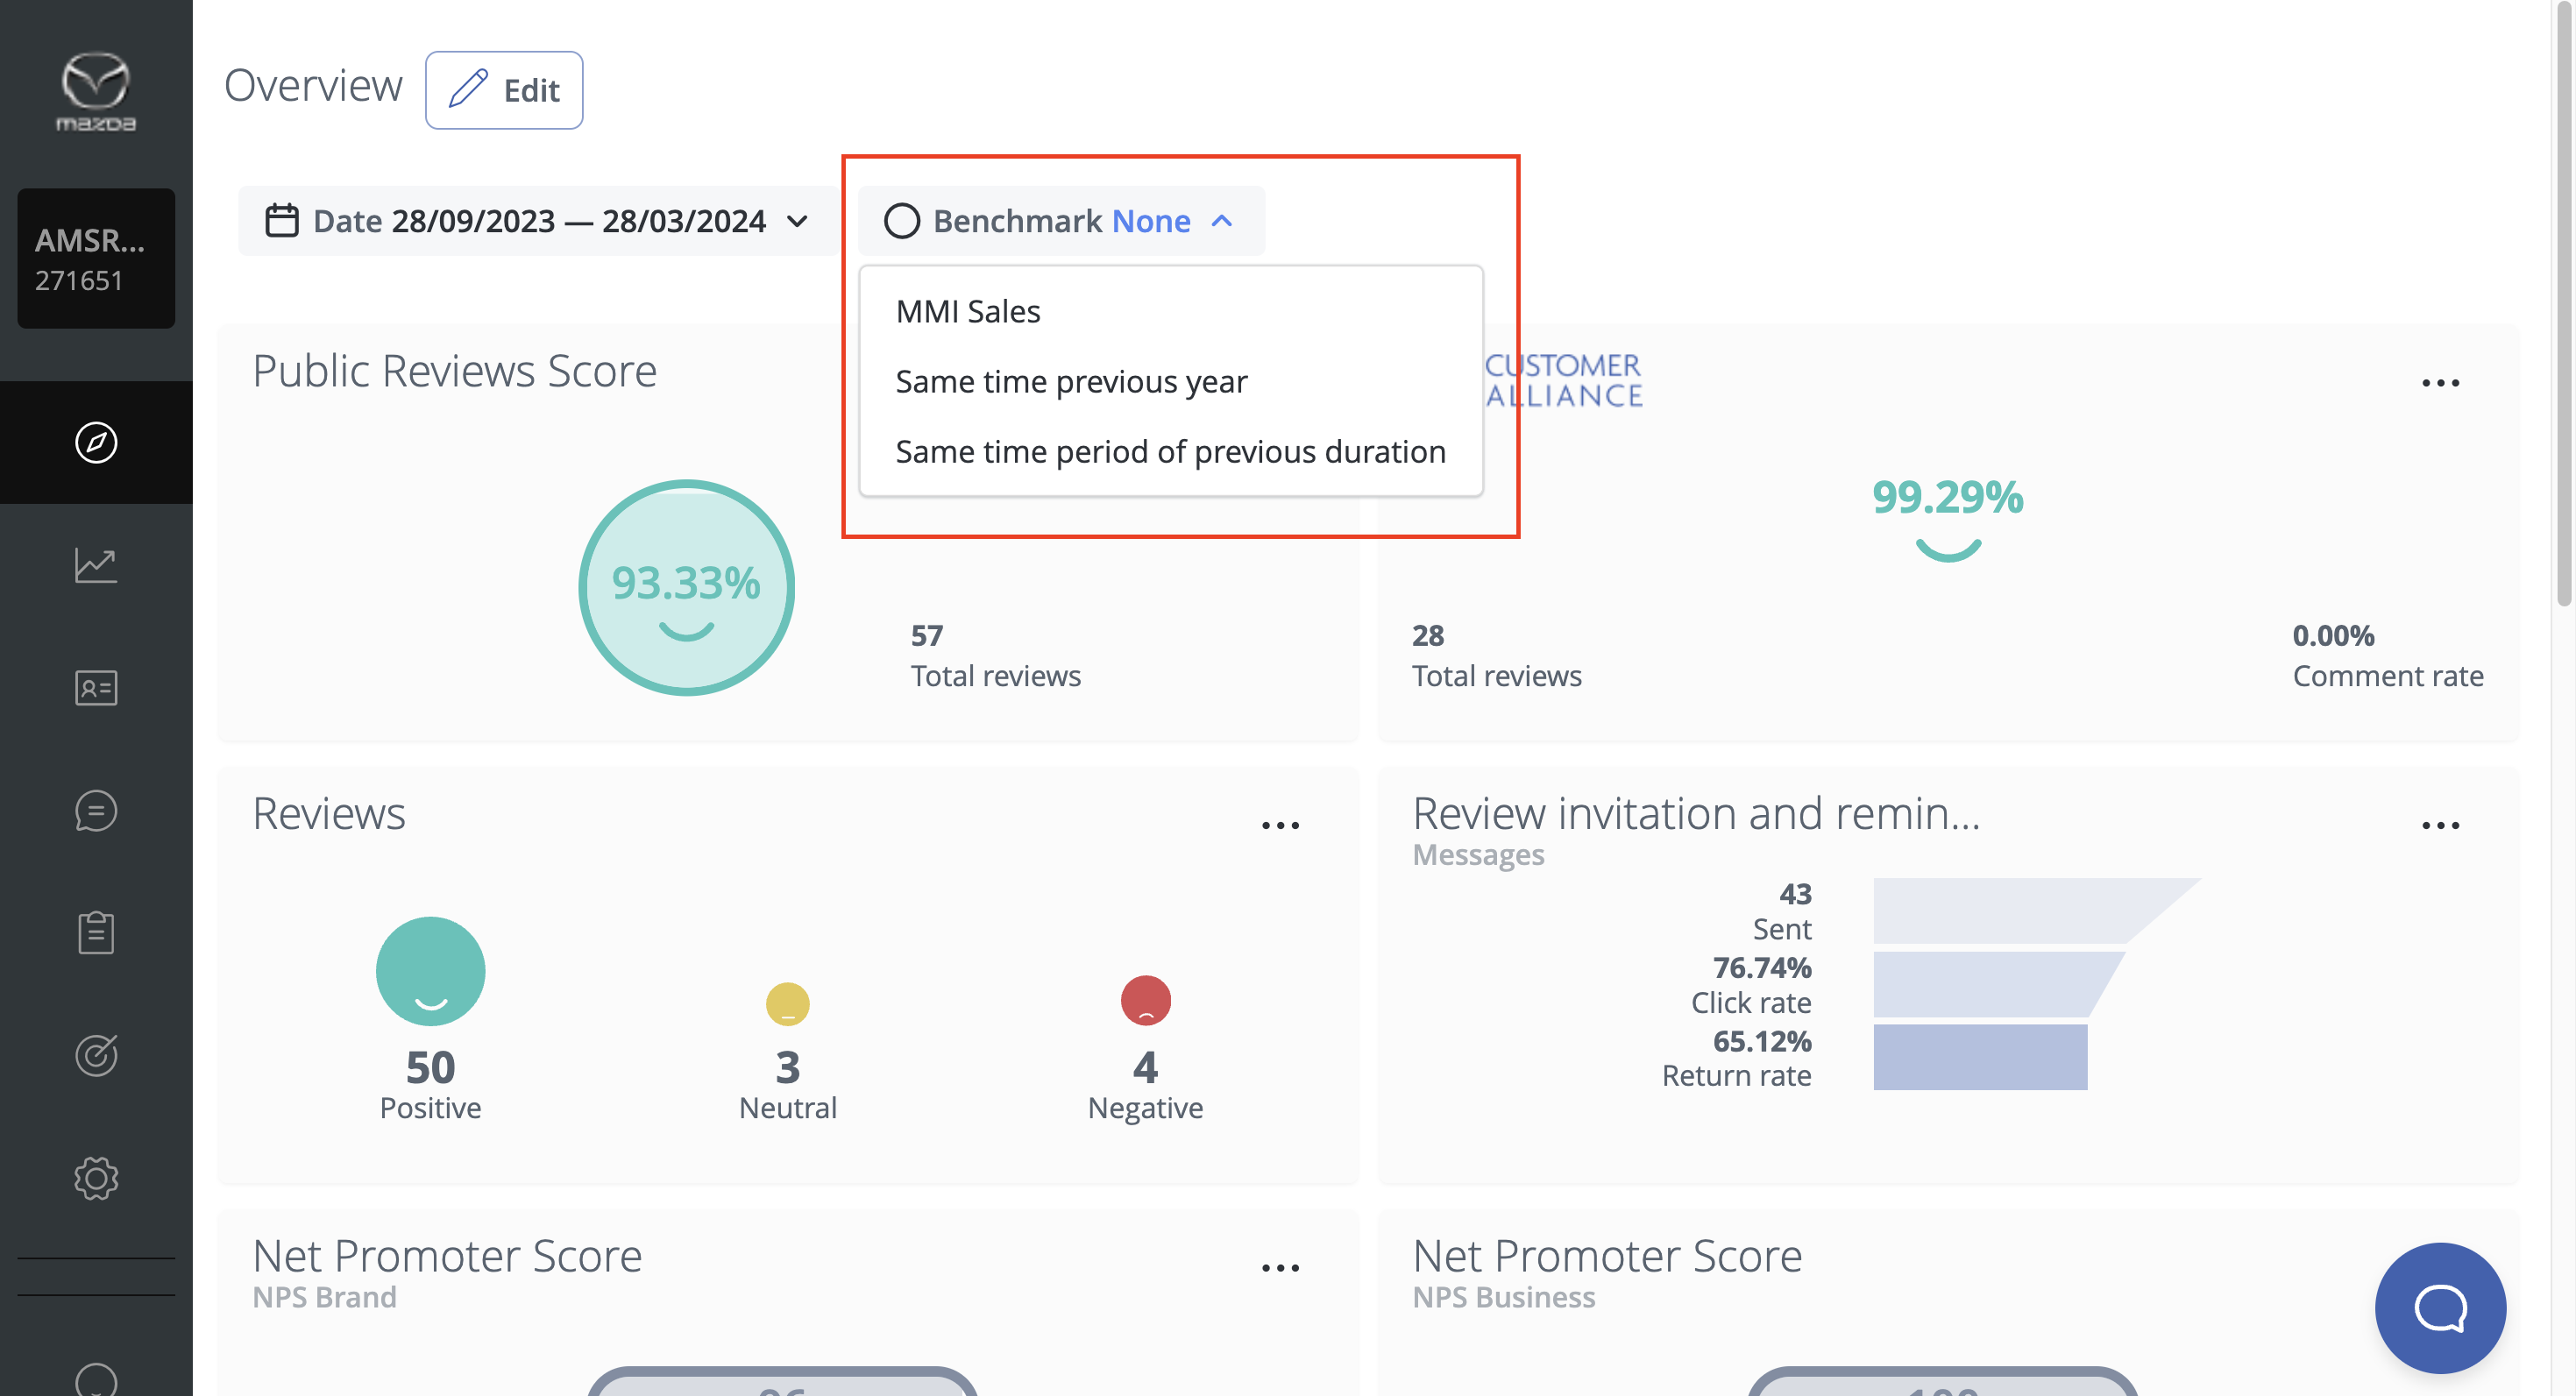
First, select the desired time frame in the filter and then choose between one of the benchmark options to display the data.
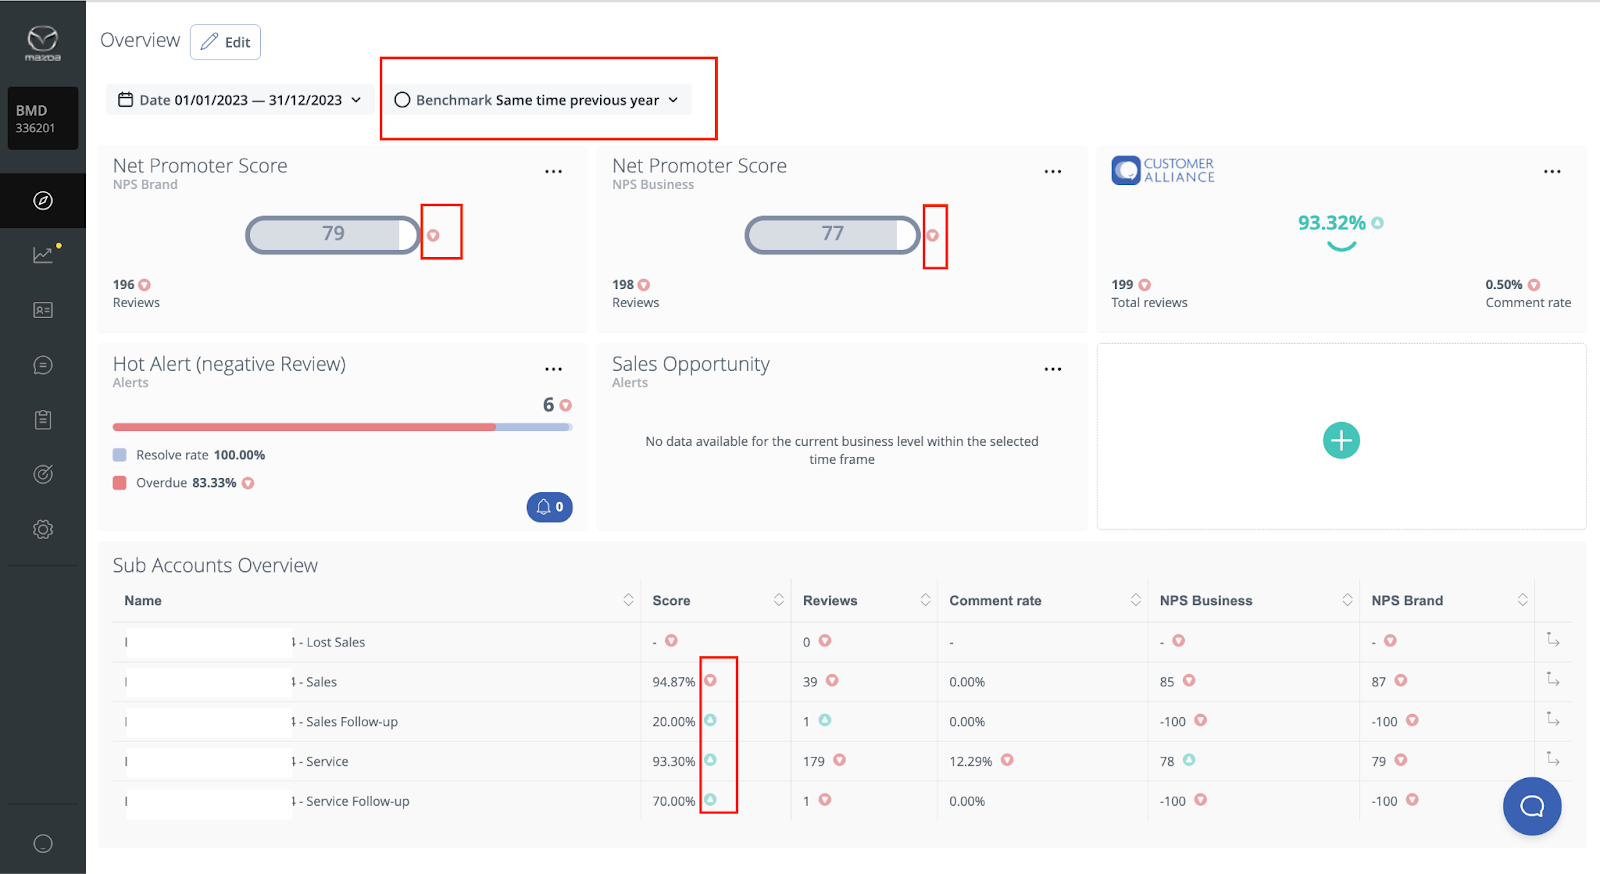
When you choose one of the options, to see the benchmark numbers just hover the mouse over the icon which is next to the numbers visible in your dashboard. If you click on this icon, you will be forwarded to the Statistics section to check all the details.
National Average calculation
In all benchmark statistics, we use the average number which is calculated based on numbers from all dealers in your country. The National Average will be constant and consistent across the platform. It means that you will see the same National Average in your zone/region/territory and in your main country account.
Did this answer your question? Thanks for the feedback There was a problem submitting your feedback. Please try again later.Yes No No results found