---
title: Your Google Business Profile Results
description: Your Google Business Profile Results
---
[Skip to content](https://support.customer-alliance.com/en/mazda2/your-google-business-profile-results#main-content)
- [English](https://support.customer-alliance.com/en/mazda2/your-google-business-profile-results)
- [Czech](https://support.customer-alliance.com/cs/mazda2/your-google-business-profile-results)
- [French](https://support.customer-alliance.com/fr/mazda2/your-google-business-profile-results)
- [German](https://support.customer-alliance.com/de/mazda2/your-google-business-profile-results)
- [Italian](https://support.customer-alliance.com/it/mazda2/your-google-business-profile-results)
- [Polish](https://support.customer-alliance.com/pl/mazda2/your-google-business-profile-results)
- [Spanish](https://support.customer-alliance.com/es/mazda2/tus-resultados-de-google-business-profile-)
English
Show submenu for translations
[Support](https://support.customer-alliance.com/en/mazda2/kb-tickets/new?hsLang=en) [Customer portal](https://support.customer-alliance.com/tickets-view?hsLang=en)

Open main navigation
Close main navigation
- - [English](https://support.customer-alliance.com/en/mazda2/your-google-business-profile-results)
- [Czech](https://support.customer-alliance.com/cs/mazda2/your-google-business-profile-results)
- [French](https://support.customer-alliance.com/fr/mazda2/your-google-business-profile-results)
- [German](https://support.customer-alliance.com/de/mazda2/your-google-business-profile-results)
- [Italian](https://support.customer-alliance.com/it/mazda2/your-google-business-profile-results)
- [Polish](https://support.customer-alliance.com/pl/mazda2/your-google-business-profile-results)
- [Spanish](https://support.customer-alliance.com/es/mazda2/tus-resultados-de-google-business-profile-)
English
Show submenu for translations
- [Support](https://support.customer-alliance.com/en/mazda2/kb-tickets/new)
- [Customer portal](https://support.customer-alliance.com/tickets-view)
How can we help you?
- There are no suggestions because the search field is empty.
1. [Mazda Academy/Customer Alliance](https://support.customer-alliance.com/en/mazda2?hsLang=en)
2. [Mazda Academy](https://support.customer-alliance.com/en/mazda2/mazda-academy?hsLang=en)
3. [Chapter 3](https://support.customer-alliance.com/en/mazda2/mazda-academy?hsLang=en#chapter-3)
# Your Google Business Profile Results
## Turn Data into Performance
Now that your connection is securely established from Chapter 2, your dashboard will begin live-syncing with Google. Welcome to your central command center!
You don’t need to be a data scientist to master this section. This chapter will introduce you to your **Google Business Profile Results** screen—the core touchpoint where you can instantly read your dealership’s local digital performance, track customer reviews, and spot areas for operational improvement.
Your CEMI platform gives the opportunity for proactive online reputation management, thanks to **External Listening Sources** monitoring.
Not only can you monitor and harness valuable insights within our platform, but you can also seamlessly track and respond to customer feedback on external platforms, such as Google.
The goal is to give you a global overview of the dealerships' web reputation.
**Overview: Dashboard**
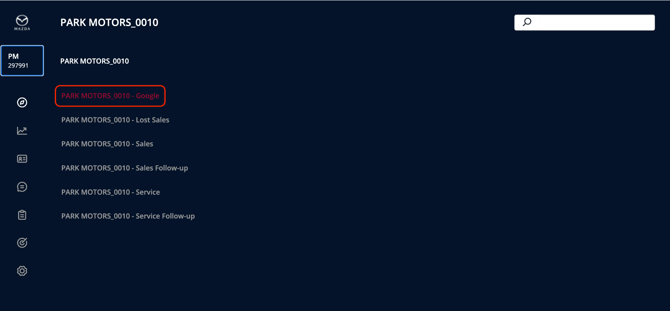
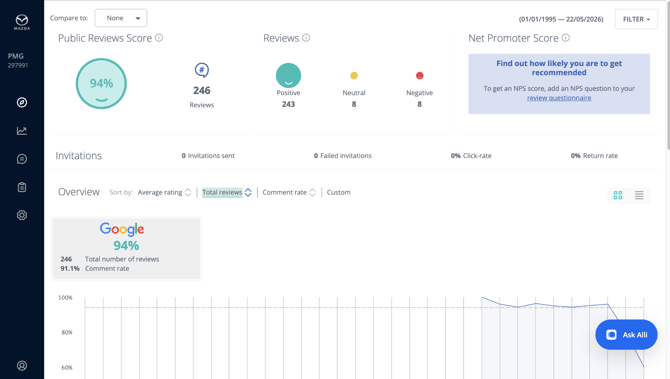
Under your Google subaccount, you will visualize some statistics related to the External Listening Sources: besides the CEMI results, also eg. Google and other car-related external portals results will be monitored and available in the Dashboard.
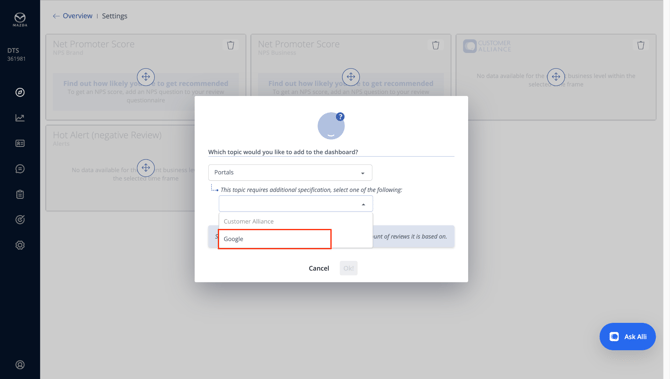
**IMPORTANT**: In the Dashboard - My KPIs you are able to add an additional tile (one tile per external portal) for external listening sources:
**Overview: Reviews Stream**
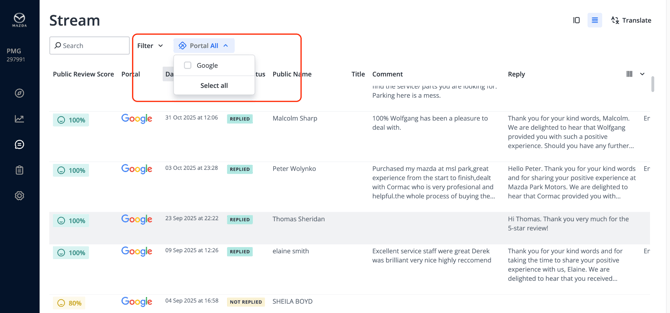
Review Stream - a centralized space displaying feedback from your external portals, **including Google alongside any other review sites you track**.
**The Key Metrics to Watch**
When reviewing your results, the platform provides deep visual insights broken down into four core pillars of information:
- **Publick Review Score:** Your live, aggregate rating on Google. Remember from Chapter 1, even a minor **0.1-star increase** can drive up your local conversion rates by **25%**!
- **Key Statistics & Volume:** Track total review volume, overall distribution, and historical score evolution over custom time periods (weekly, monthly, or quarterly) to monitor your team's growth trends.
- **Response Rates:** The percentage of reviews your team has successfully replied to. Keeping this number high signals to both Google's algorithm and potential car buyers that your dealership values its customers.
- **The Sentiment Proportion Graphic:** A clear, color-coded visual chart that splits your customer feedback into positive and negative proportions, allowing you to instantly gauge your showroom's overall mood at a single glance.
**⏭️ Next Up**
Understanding your data is only half the battle—the real magic happens when you act on it. Proceed to [**Chapter 4 – Answering to Comments**](https://support.customer-alliance.com/en/mazda2/answering-to-comments?hsLang=en), where we will show you exactly how to read and reply to your customer reviews directly inside this platform to save your team time and boost your local loyalty.
[](http://www.customer-alliance.com)
[mailto:email@email.com](mailto:email@email.com)
Copyright © 2026, CA Customer Alliance GmbH